Protostar
From Wikipedia, the free encyclopedia
| Star Formation |
 |
| Classes of Object |
| Theoretical Concepts |
| |

A protostar is a large object that forms by contraction out of the gas of a giant molecular cloud in the interstellar medium. The protostellar phase is an early stage in the process of star formation. For a solar-mass star it lasts about 100,000 years. It starts with a core of increased density in a molecular cloud and ends with the formation of a T Tauri star, which then develops into a main sequence star. This is heralded by the T Tauri wind, a type of super solar wind that marks the change from the star accreting mass into radiating energy.
Observations are revealed that giant molecular clouds are approximately in a state of virial equilibrium—on the whole, the gravitational binding energy of the cloud is balanced by the thermal pressure of the cloud's constituent molecules and dust particles. Although thermal pressure is likely the dominant effect in counteracting gravitational collapse of protostellar cores, magnetic pressure, turbulence and rotation can also play a role (Larson, 2003). Any disturbance to the cloud may upset its state of equilibrium. Examples of disturbances are shock waves from supernovae; spiral density waves within galaxies and the close approach or collision of another cloud. If the disturbance is sufficiently large, it may lead to gravitational instability and subsequent collapse of a particular region of the cloud.
The British physicist Sir James Jeans considered the above phenomenon in detail. He was able to show that, under appropriate conditions, a cloud, or part of one, would start to contract as described above. He derived a formula for calculating the mass and size that a cloud would have to reach as a function of its density and temperature before gravitational contraction would begin. This critical mass is known as the Jeans mass. It is given by the following formula:
where n is the particle number density, m is the mass of the 'average' gas particle in the cloud and T is the gas temperature.
Contents[hide] |
[edit] Fragmentation
Stars are often found in groups known as clusters which appear to have formed at around the same time. This can be explained if it is assumed that as a cloud contracts it does not do so uniformly. In fact, as first pointed out by Richard Larson, the giant molecular clouds in which stars are formed are universally observed to have turbulent velocities imposed on all scales within the cloud. These turbulent velocities compress the gas in shocks, which generate filaments and clumpy structures within the giant molecular cloud over a wide range of sizes and densities. This process is referred to as turbulent fragmentation. Some clumpy structures will exceed their Jeans mass and become gravitationally unstable, and may again fragment to form a single or multiple star system.
Whatever the reason, the cloud breaks up into smaller, denser areas which may again break into still smaller areas - the outcome being a cluster of protostars. This certainly agrees with the observation that star clusters are common, but not always huge.
[edit] Heating due to gravitational energy
As the cloud continues to contract it begins to increase in temperature. This is not caused by nuclear reactions but by the conversion of gravitational energy to thermal kinetic energy. As a particle (atom or molecule) decreases its distance from the centre of the contracting fragment this will result in a decrease in its gravitational energy. The total energy of the particle must remain constant so the reduction in gravitational energy must be accompanied by an increase in the particle's kinetic energy. This can be expressed as an increase in the thermal kinetic energy, or temperature, of the cloud. The more the cloud contracts the more the temperature increases.
Collisions between molecules often leave them in excited states which can emit radiation as those states decay. The radiation is often of a characteristic frequency. At these temperatures (10 to 20 kelvins) the radiation is in the microwave or infrared range of the spectrum. Most of this radiation will escape, preventing the rapid rise in temperature of the cloud.
As the cloud contracts the number density of the molecules increases. This will eventually make it more difficult for the emitted radiation to escape. In effect, the gas becomes opaque to the radiation and the temperature within the cloud will begin to rise more rapidly.
The fact that the cloud becomes opaque to radiation in the infrared makes it difficult for us to observe directly what is happening. We must look to longer wavelength radio radiation which does escape even the densest clouds. In addition, theory and computer modelling are necessary to understand this phase.
As long as the surrounding matter is falling onto the central condensation, it is considered to be in protostar stage. When the surrounding gas/dust envelope disperses and accretion process stops, the star is considered as pre-main sequence star. In HR diagram then it appears to be on the stellar birthline.
[edit] History
The term "proto-star" appears to have been first used in print in 1889.
"A protostar acquiring two condensations will become a binary and be stable thereafter [..] Whether a binary or a single star results depends largely on the total angular momentum of the protostarStellar Spectral TypesStars can be classified by their surface temperatures as determined from Wien's Displacement Law, but this poses practical difficulties for distant stars. Spectral characteristics offer a way to classify stars which gives information about temperature in a different way - particular absorption lines can be observed only for a certain range of temperatures because only in that range are the involved atomic energy levels populated. The standard classes are:
The commonly used mnemonic for the sequence of these classifications is "Oh Be A Fine Girl, Kiss Me". Spectral Class CharacteristicsData from J. C. Evans, George Mason University
| Index Star concepts | ||||||||||||||||||||||||||||||||||||||||||||||||||||||||
| Go Back |
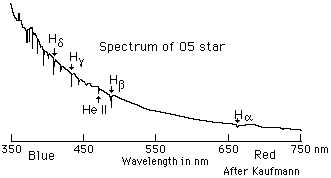
O-Type StarsIncluded are blue stars with surface temperatures of 20,000 to 35,000K. The thermal energy is so great at these temperatures that most surface hydrogen is completely ionized so hydrogen (HI) lines are weak. Unionized helium (HeI) is visible but the stronger spectra are of mulitple ionized atoms (HeII, CIII, NIII,OIII,SiV). Note the rise of the spectral curve toward the blue from the blackbody radiation curve.
| Index Star concepts Reference Kaufmann | ||||
| Go Back |
O-Type StarsThe spectra of O-Type stars shows the presence of hydrogen and helium. At these temperatures most of the hydrogen is ionized, so the hydrogen lines are weak. Both HeI and HeII (singly ionized helium) are seen in the higher temperature examples. The radiation from O5 stars is so intense that it can ionize hydrogen over a volume of space 1000 light years across. One example is the luminous H II region surrounding star cluster M16. O-Type stars are very massive and evolve more rapidly than low-mass stars because they develop the necessary central pressures and temperatures for hydrogen fusion sooner. Because of their early development, the O-Type stars are already luminous in the huge hydrogen and helium clouds in which lower mass stars are forming. They light the stellar nurseries with ultraviolet light and cause the clouds to glow in some of the dramatic nebulae associated with the H II regions.
| Index Star concepts Reference Kaufmann | ||
| Go Back |
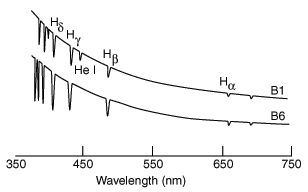
B-Type StarsBlue-white stars with surface temperatures of about 15000K. The ionized helium (HeII) lines of the O-type stars have disappeared and neutral helium (HeI) lines are strongest at B2. The neutral hydrogen (HI) lines are getting stronger and singly ionized OII, SiII and Mg II are visible. A significant rise of the blackbody spectrum toward the blue is still evident.  These are sketches of spectra in Kaufmann. The original data are attributed to G. Jacoby, D. Hunter and C. Christian.
| Index Star concepts Reference Kaufmann | ||
| Go Back |
Nova
From Wikipedia, the free encyclopedia
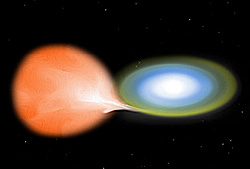
A nova (pl. novae or novas) is a cataclysmic nuclear explosion caused by the accretion of hydrogen onto the surface of a white dwarf star. Novae are not to be confused with Type Ia supernovae, or another form of stellar explosion first announced by Caltech in May 2007, Luminous Red Novae.
Contents[hide] |
[edit] Occurrence rate, and astrophysical significance
Astronomers estimate that the Milky Way experiences roughly 30 to 60 novae per year, with a likely rate of about 40.[1] The number of novae discovered in the Milky Way each year is much lower, about 10.[2]. Roughly 25 novae brighter than about magnitude 20 are discovered in the Andromeda Galaxy each year and smaller numbers are seen in other nearby galaxies.[3]
Spectroscopic observation of nova ejecta nebulae has shown that they are enriched in elements such as helium, carbon, nitrogen, oxygen, neon, and magnesium.[1] The contribution of novae to the interstellar medium is not great; novae supply only 1/50th the amount of material to the Galaxy as supernovae, and only 1/200th that of red giant and supergiant stars.[1]
Recurrent novae like RS Ophiuchi (those with periods on the order of decades) are rare. Astronomers theorize however that most, if not all, novae are recurrent, albeit on time scales ranging from 1,000 to 100,000 years.[4] The recurrence interval for a nova is less dependent on the white dwarf's accretion rate than on its mass; with their powerful gravity, massive white dwarfs require less accretion to fuel an outburst than lower-mass ones.[1] Consequently, the interval is shorter for high-mass white dwarfs.[1]
[edit] Historical significance
The astronomer Tycho Brahe observed the supernova SN 1572 in the constellation Cassiopeia, and described it in his book de stella nova (Latin for "concerning the new star"), giving rise to the name nova. In this work he argued that a nearby object should be seen to move relative to the fixed stars, and that the nova had to be very far away. Though this was a supernova and not a classical nova, the terms were considered interchangeable until the 1930s.[1]
[edit] Novae as distance indicators
Novae have some promise for use as standard candles. For instance, the distribution of their absolute magnitude is bimodal, with a main peak at magnitude -8.8, and a lesser one at -7.5. Novae also have roughly the same absolute magnitude 15 days after their peak (-5.5). Comparisons of nova-based distance estimates to various nearby galaxies and galaxy clusters with those done with Cepheid variable stars have shown them to be of comparable accuracy.[5]
[edit] Bright novae since 1890
A more complete list of novae in the Milky Way since 1612 is maintained by the Central Bureau for Astronomical Telegrams, CBAT[2]


No comments:
Post a Comment